Matplotlib
Matplotlib is a Python library written to help create visualizations. Unlike other similar libraries, Matplotlib is specifically written for Python. It is open source and there have been several contributors that have written portions in C, Objective-C, and JavaScript.[1]
To install the Matplotlib library, install onto your version of Python from command line using the following command:
pip install matplotlib
Pyplot is a Matplotlib module that provides a MATLAB like interface. Pyplot provides functions that interact with the figure i.e. creates a figure, decorates the plot with labels, creates plotting area in a figure. It is a pretty extensive module of the library and generally when using Mathplotlib, is a good idea to have a reference directly to pyplot.
In Matplotlib there are two key concepts to understand about the library. Figures are objects which can be considered as a box-like container that can hold one or more axes. It is the top-level container for all the plots and is the overall window or page on which everything is drawn.
Axes are individual plots or graphs and are flexible components for creating sub-plots. A given figure may contain many axes but an axes can only belong to only figure ultimately..[2]
Sources:[1]:W3Schools - Matplotlib Tutorial Intro
[2]:Geeks For Geeks - Matplotlib Tutorial
Visualizations
The Matplotlib library offers a wide variety of graphs, charts, and other visualizations to create with just a few lines of code. The Matplotlib library offers the following visualizations to create:
- pie charts
- scatter plots
- line graphs
- bar graphs
- histograms
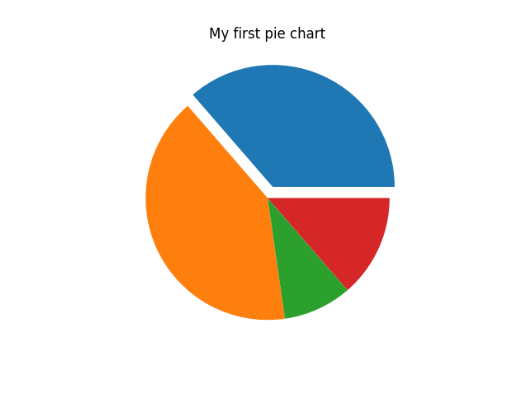
Pie Charts
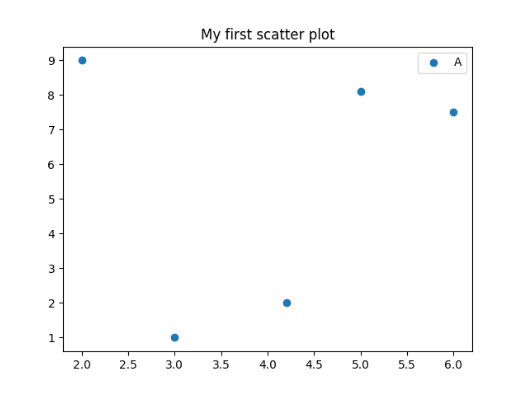
Scatter Plots
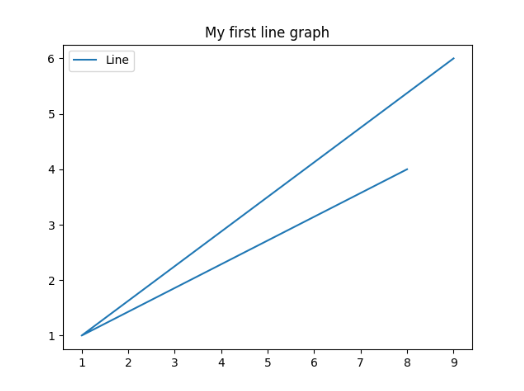
Line Graphs
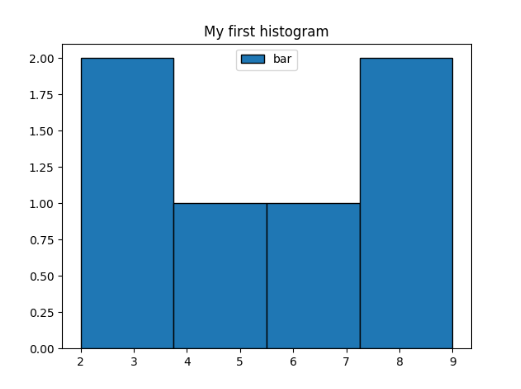
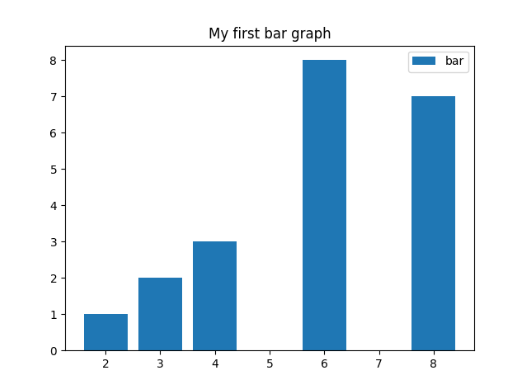
Bar Graphs
Histograms