Bokeh
Bokeh is a library used for creating interactive visualizations for modern web browsers.
Unlike other similar visualization libraries that exist for Python, Bokeh displays to the screen also utilizing HTML and JavaScript. Because of this, Bokeh is a great choice of a library when choosing to incorporate them into web applications.
To install the Bokeh library, install onto your version of Python from command line using the following command:
pip install bokeh
When rendering your visualization, you can use one of two methods to output it to the screen:
- output_file('filename.html') - you can use this to write your visualization to a static HTML file.
- output_notebook() - this will render your visualization directly in Jupyter Notebook.
However, note that the visualization won't actually be displayed on the screen until you call show()
Source: Towards Data Science: Data Visualization with BokehVisualizations
The bokeh library offers a wide variety of graphs, charts, and other visualizations to create with just a few lines of code. The bokeh library offers the following visualizations to create:
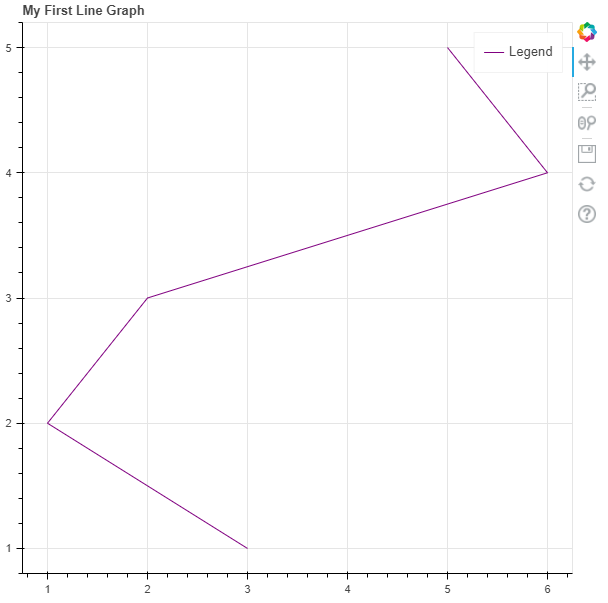
- line graphs
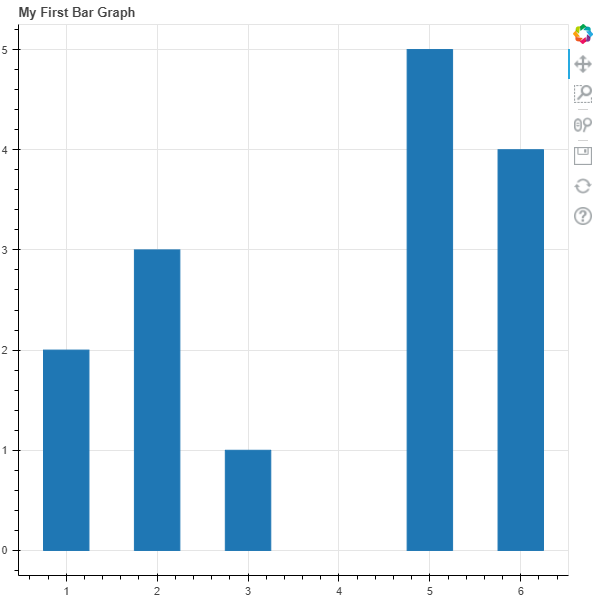
- bar graphs
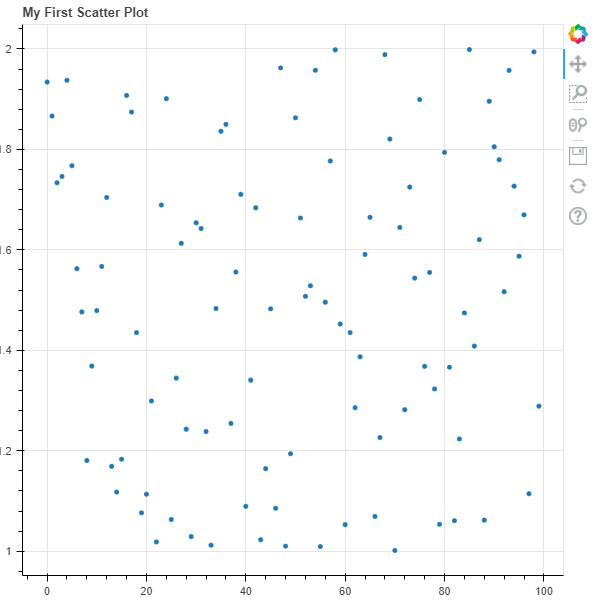
- scatter plots
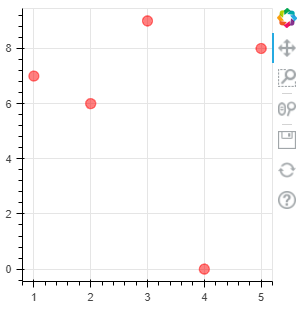
- scatter markers
Line Graphs
Bar Graphs
Scatter Plots
Scatter Markers
Description
A YouTube tutorial on creating data visualizations in Python using the Bokeh library.