Uploading Excel Files

How to Import an Excel File into Python using Pandas

Link


Personal Project


Stock data analysisStock data analysis


There are three main analysis methods for stock investment: basic analysis, technical analysis, and evolution analysis. The basic analysis is mainly used in the selection of investment objects, and the technical analysis and evolution analysis are mainly used in the time and space judgments of specific investment operations. As an important means to improve the validity and reliability of investment analysis.


  • Basic analysis: The basic analysis method is based on traditional economic theories, with corporate value as the main research object, through detailed analysis of the macroeconomic situation, industry development prospects, and corporate operating conditions that determine the internal value of the company and affect the stock price. Calculate the long-term investment value and margin of safety of listed companies in general, and compare them with the current stock prices to form corresponding investment recommendations. Basic analysis believes that stock price fluctuations cannot be accurately predicted, and that stocks can only be bought and held for a long time when there is a sufficient margin of safety.

  • Technical analysis: The technical analysis method is based on the traditional securities theory, the stock price is the main research object, and the main purpose is to predict the trend of stock price fluctuations. Starting from the historical chart of stock price changes, the sum of the methods of analyzing the law of stock market fluctuations . Technical analysis believes that market behavior is inclusive and digestible, and stock price fluctuations can be quantitatively analyzed and predicted, such as Dow Theory, Wave Theory, Gann Theory, etc.

  • Evolutionary analysis: The evolutionary analysis method is based on the theory of evolutionary securities, taking the life movement characteristics of stock market volatility as the main research object, from the metabolism, profitability, adaptability, plasticity, stress, variability and rhythm of the stock market Starting from aspects such as sex, dynamic tracking research on the direction and space of market volatility, to provide a combination of opportunities and risk assessment methods for stock trading decisions. Evolutionary analysis believes that stock price fluctuations cannot be accurately predicted, so it belongs to the category of fuzzy analysis. It does not attempt to provide quantitative descriptions and predictions for the trajectory of stock price fluctuations, but focuses on establishing a new analysis framework for investors to scientifically observe and understand the logic of stock market fluctuations. . Technical analysis should not be a stock trading technique, but it should include relationships. In stock trading, when we conduct technical analysis, we usually first study the three axioms of technical analysis. These three axioms can explain and analyze all aspects of the stock market.

  • Target


    Analyze the status quo,Analyze the reasons,Fortune-telling


    Through the above three goals, observe the rise and fall data and the magnitude of the rise and fall, and analyze whether the stocks are stable. Choose relatively stable ones to increase revenue.


    Specific analysis content


    Analyze the status quo


    Under the current market environment, it is necessary to clarify what is the stock price of the product, what is the source, what is the purchase rate and the selling rate, what is the competing product, what is the development status of the competing product, what are our advantages compared with our competitors, and what are our shortcomings? What are there and so on, belong to the analysis of the status quo. This includes two aspects, analyzing one's own current situation and analyzing the current situation of competitors.


    Analyze the reasons


    In stocks, we often encounter large fluctuations in stock prices, and sometimes sudden large losses in prices, causing market value to evaporate. Every change has a reason. What needs to be done is to find out the reason and give a solution.


    Fortune-telling


    According to the recent product data changes, according to the strength of the trend line and operation strategy, to predict the future trend, and use the next period of time to verify whether this trend is feasible and achieve data-driven business growth.


    Quantitative trading (investment method)


    Use advanced mathematical models to replace human subjective judgments, and use computer technology to select multiple "high probability" events that can bring excess returns from huge historical data to formulate strategies, which greatly reduces the impact of investor sentiment fluctuations. Avoid making irrational investment decisions when the market is extremely fanatical or pessimistic.


    Quantitative trading is generally tested by means of massive data simulation tests and simulated operations, and positions and capital allocation are carried out according to certain risk management algorithms to minimize risks and maximize returns, but there are often certain potential risks.


    Algorithmic trading (automatic trading, black box trading or machine trading) By designing algorithms, using computer programs to issue trading instructions. In trading, the range that the program can determine includes the choice of trading time, the price of the transaction, and even the number of assets that need to be traded in the end.


    Quantitative strategy


    Use a computer as a tool to analyze, judge and make decisions through a set of fixed logic. Quantitative strategies can be executed automatically or manually.


    A complete strategy needs to include input, strategy processing logic, and output; strategy processing logic needs to consider factors such as stock selection, timing, position management, stop-profit and stop-loss.


    Quantitative stock selection


    Use a quantitative method to select a certain investment portfolio, hoping that such an investment portfolio can obtain investment returns that surpass the broader market.


    Commonly used quantitative stock selection models: multi-factor stock selection model, industry rotation stock selection, style rotation model, capital flow model, momentum reversal model, consensus expectation model, trend tracking stock selection, etc.


    Stock backtesting


    The process of reasonable verification of trading strategies in historical data.


    The significance of stock backtesting: strategy selection, strategy optimization, and strategy verification.


  • Open: The first transaction price per share after the market opens on each trading day

  • High/: Low The highest price is a good selling price, and the lowest price is a good buying price. The degree of stock price fluctuation and whether it exceeds the normal range can be judged according to the price range.

  • Close: The volume weighted average price of all transactions one minute before the last transaction, no matter how the stock price fluctuates on the day, it will eventually be fixed at the closing price

  • Volume: Refers to the number of transactions for a certain transaction in a unit of time. The stock trend can be judged according to the increase or decrease of the transaction volume, and the relationship between supply and demand and the degree of activity in the market can be predicted

  • Market Value: The total value of the market price can be used to measure the operating conditions of the stock issuing company by the increase or decrease of the market value

  • Turnover: Refers to the frequency of stocks changing hands in the market within a certain period of time, and is one of the indicators that reflect the strength of the stock’s liquidity

  • Pe: Price-to-earnings ratio, the ratio of stock price divided by earnings per share. It is one of the indicators to assess whether the stock price level is reasonable. It reflects the recent performance of the company. The length of the investment payback period and investment risk can be judged according to its size.

  • Pb: Price-to-book ratio, stock price divided by book value, can measure the investment value and investment risk of this stock


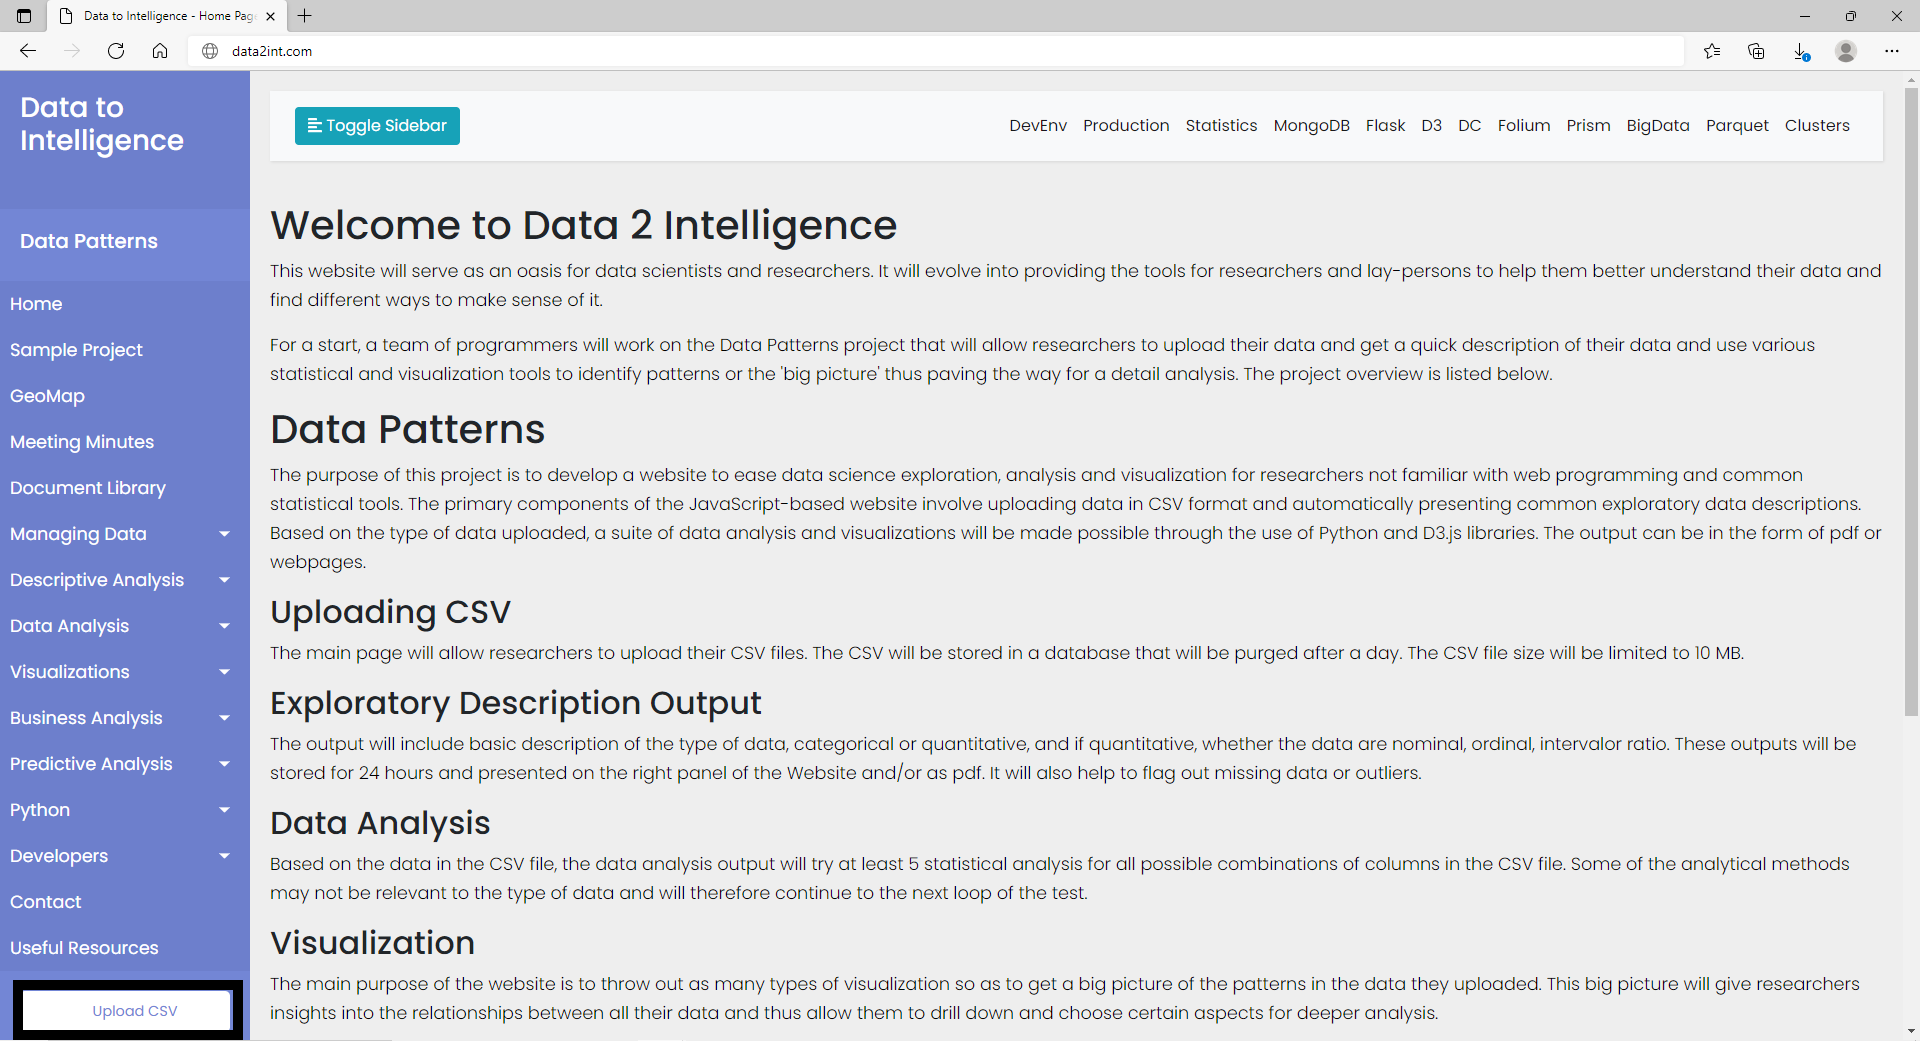
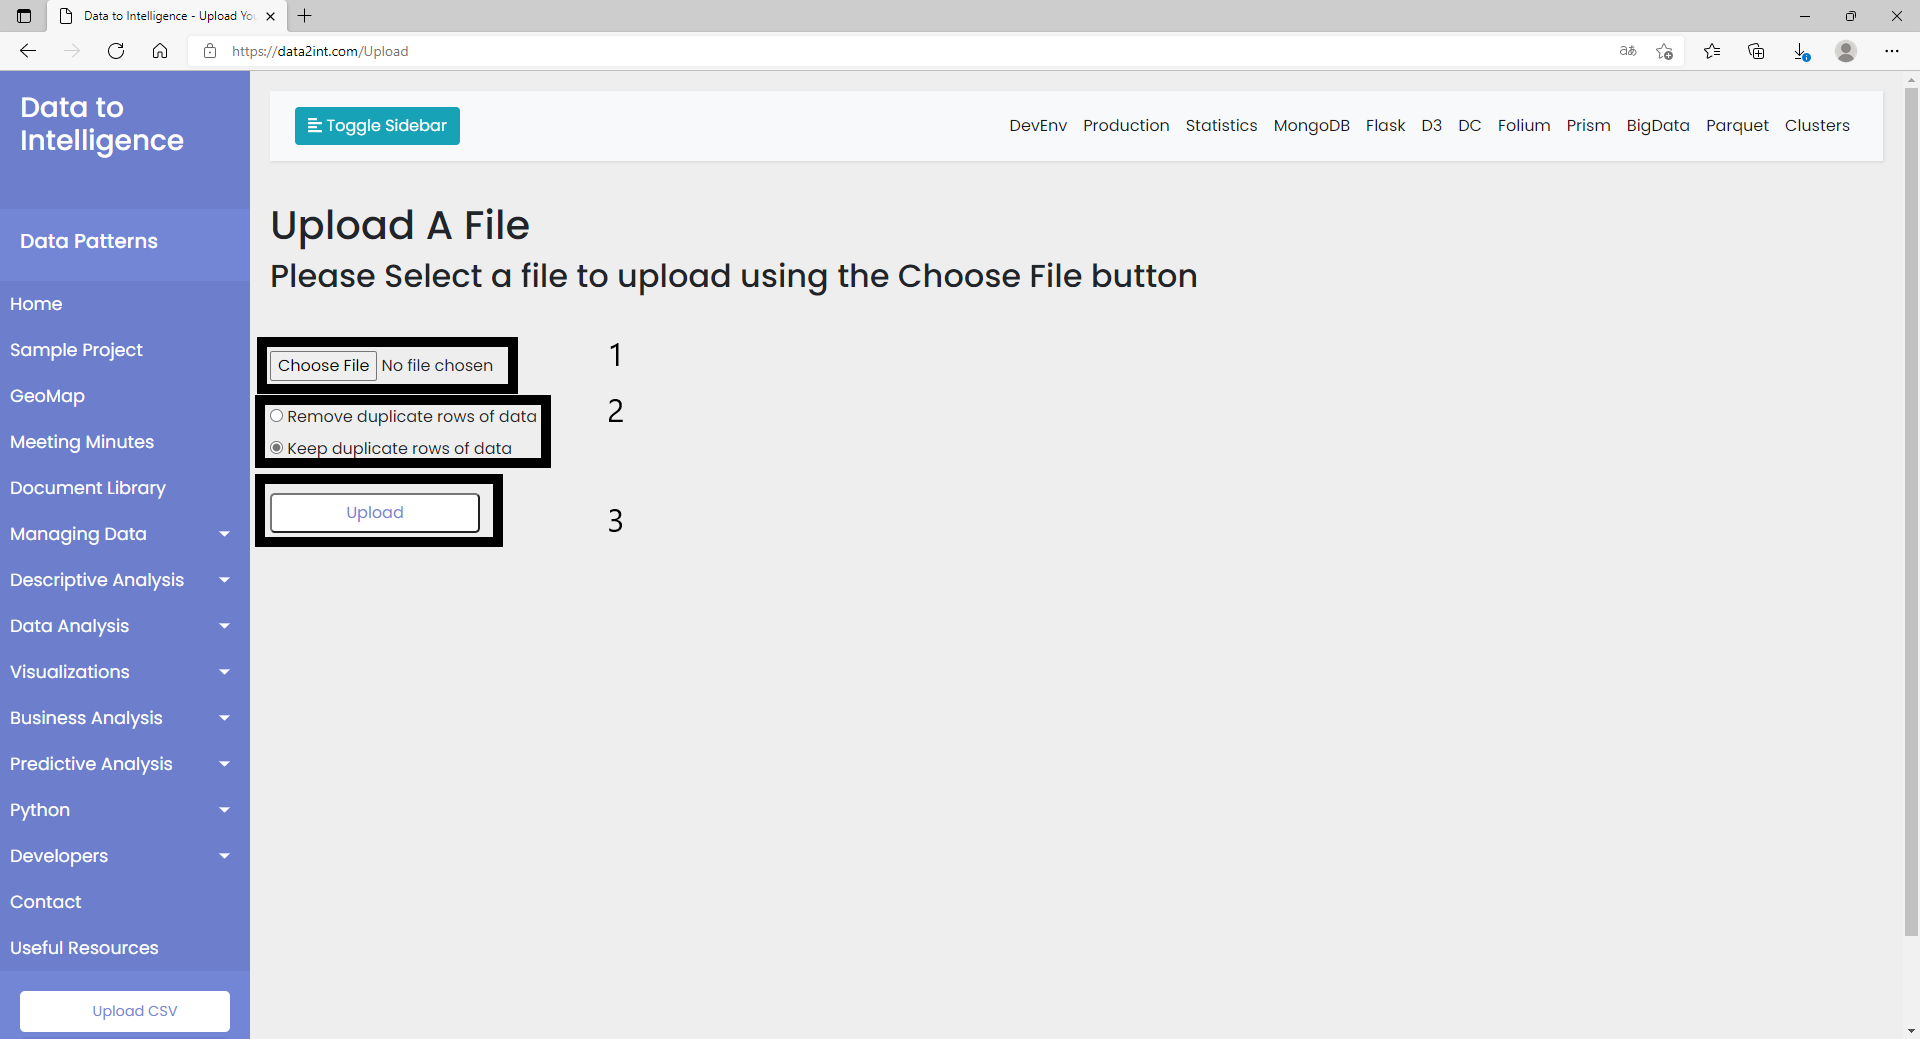
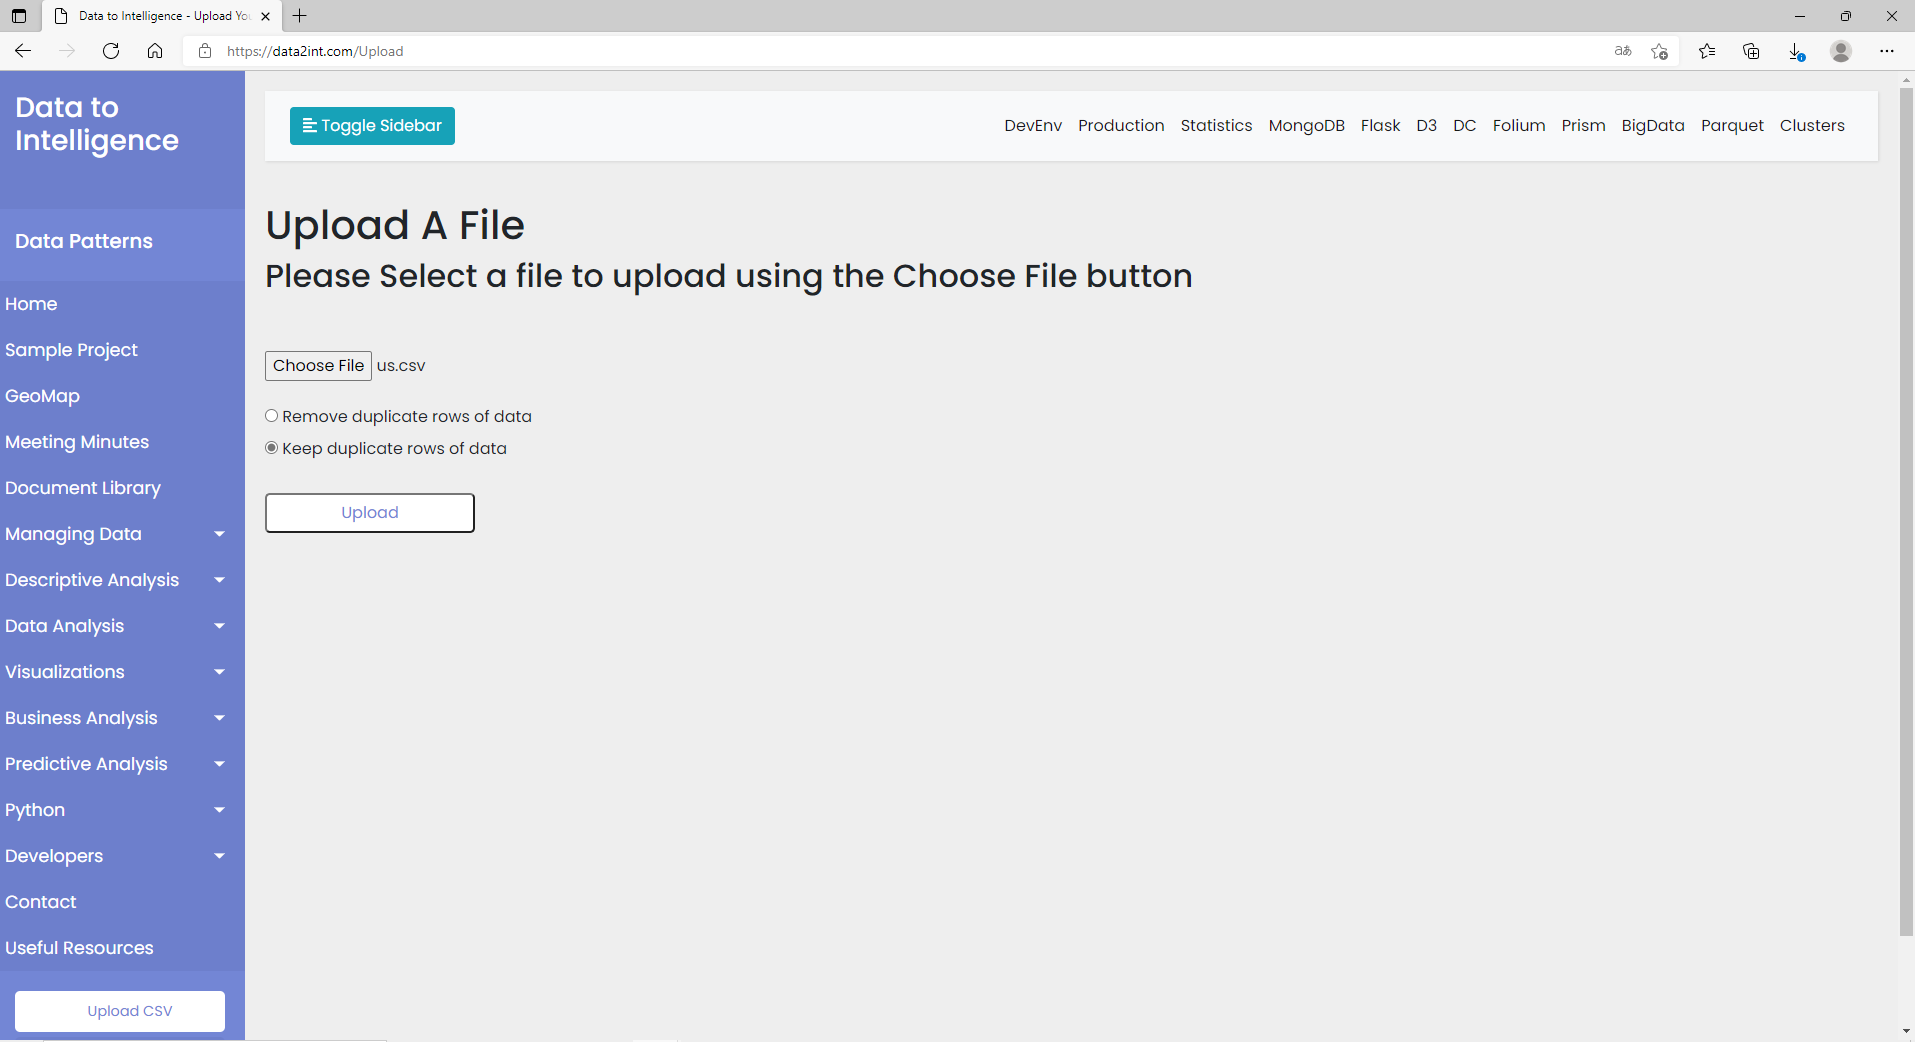
  • Data analysis application

    Here will introduce how to use our visualization data step by step


  • Open the website https://data2int.com/ You will see the same website as in the picture

  • Click the Upload CSV button on the left side of the website


  • Create Remote Host

  • After that, we will see the following screen, complete the upload according to the prompt information

  • First select the CSV file you want to analyze

  • The second choice is whether to delete duplicate data

  • Finally, click Upload to complete the upload operation


  • Create Remote Host

  • Now take stock analysis as an example. After I uploaded a CSV file, please be patient and wait for the analysis result


  • Create Remote Host

  • The page prompts that the data analysis has been completed, and the visualization of the data can be seen


  • Create Remote Host


    Create Remote Host

  • This is the end of using data analysis visualization. If you want to select a new file for visualization, please repeat the first operation, thank you for using

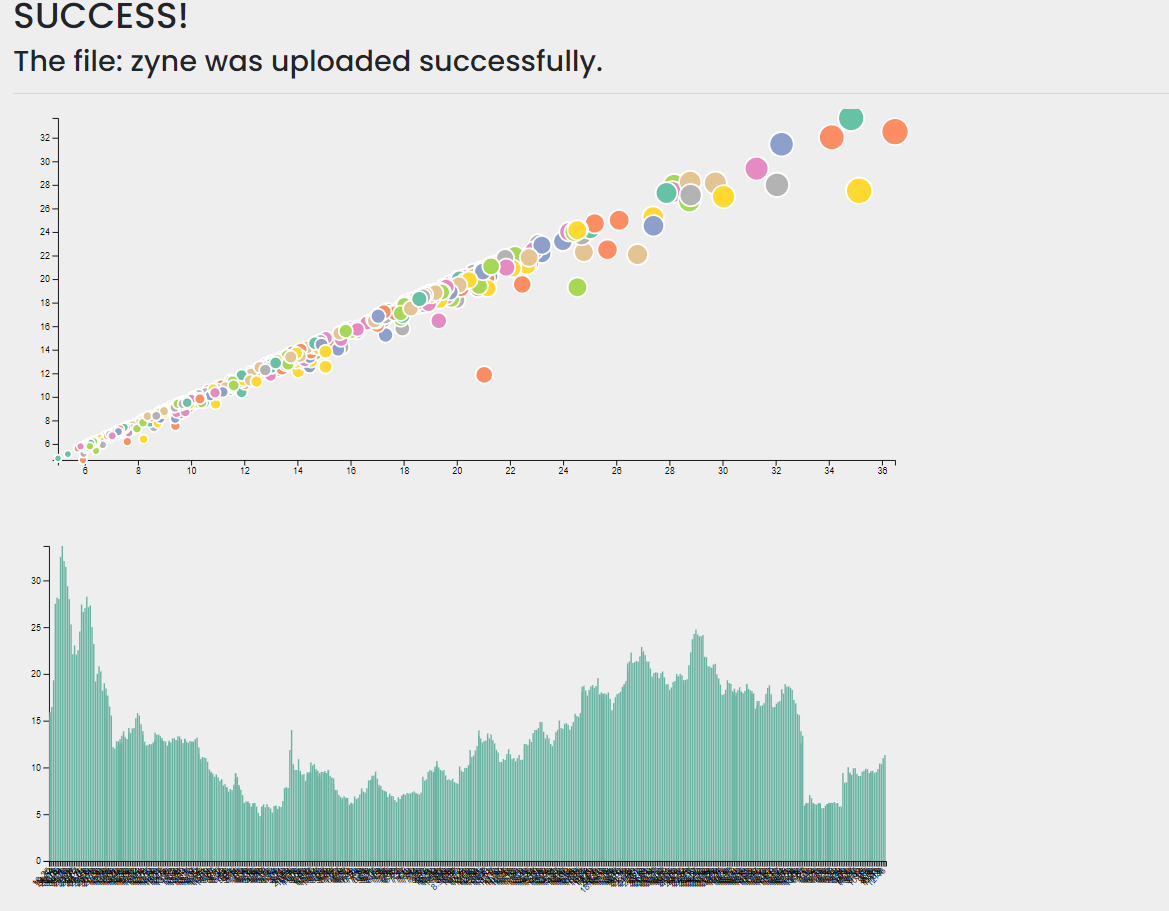
  • Data analysis report


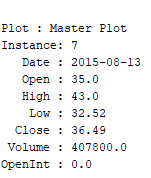
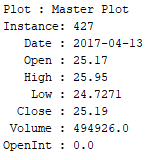
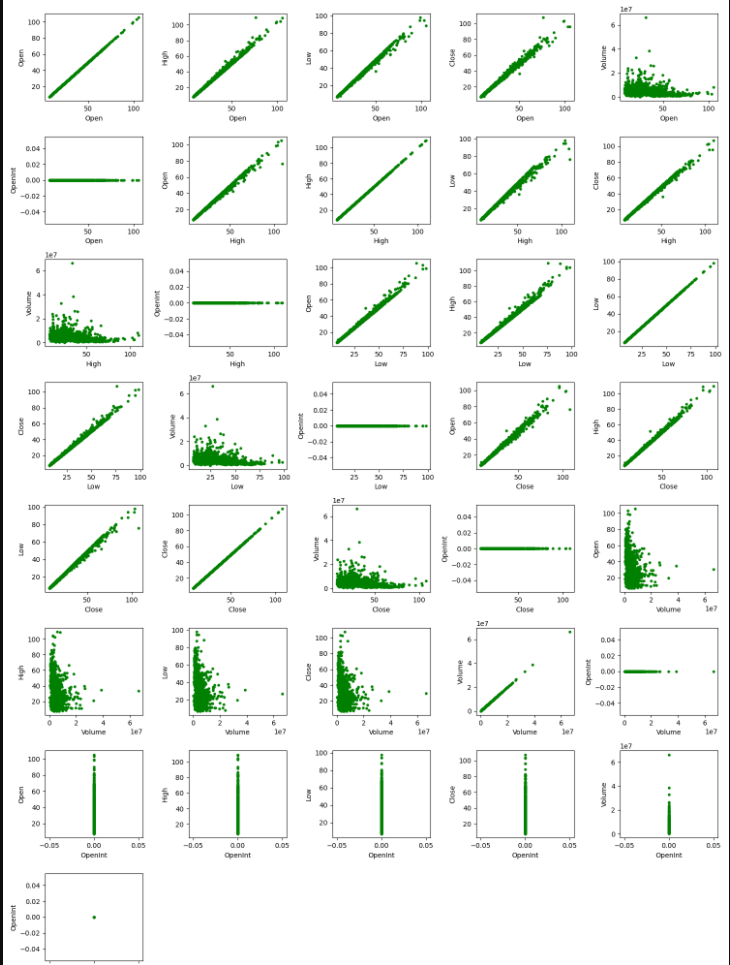
    After performing the previous step, we got the data results analyzed by the website.


    Create Remote Host

    It can be seen that there are 7 attributes and 574 instances of the data in this research, namely Date Open High Low Close Volume OpenInt.

  • Now starting our analysis, with the increase of date, there is no substantial change to open int, we can ignore it.

  • Looking at Volume, the overall trend remains the same, with only a few data increasing as the Date increases.

  • For Open, High, Low, and Close, their relationship with Date is basically the same. At first, they showed a rapid decline, but then slowly increased, and after reaching a certain level, they began to fall again.

  • The following are the two highest values of their value in the ups and downs.
    Create Remote Host


    Create Remote Host

  • With the increase of Open, High, Low, and Close, they have no substantial changes to open int, and we can ignore them.

  • In Volume, the overall trend remains the same. At the beginning, the data showed a free state, and it looked like it wanted to get away from the overall trend, but there was not much data out of it. Generally speaking, it was maintained with Open, High , Low, Close increase with the increase.

  • It can be seen that in 2015-2017, nearly two years have not reached the peak at the beginning. After the results of my analysis, please wait and see for a while. It is not the best time to buy this stock. However, if you want to buy the bottom and wait for the price to rebound, this is also possible. It varies from person to person. It depends on where you are starting. We should wait and see for a period of time before deciding whether to buy or not. After all, time will give us the answer.

  • The following statistics show that Open has a historical low of 4.75 and a high of 37.98. This gap is very huge.

  • High has a historical low of 5.4 and a historical high of 43.00.

  • Low is a historical low of 4.64 and a historical high of 33.68.

  • Close the historical low is 4.99 and the historical high is 36.49.